Las Vegas AC Age Report 2026: Home Age by ZIP Code, Summer Heat and Replacement Timing
Published by Colton Air Conditioning (NV Lic. 0092120). Data current as of November 12, 2026.
Key findings
- Las Vegas-area homes are young by national standards. The median home in Clark County was built in 1998, compared with 1980 for the United States as a whole.1
- Most homes still predate 2010. About 84% of Clark County housing units (83.8%) were built before 2010.2 In 51 of the 56 valley ZIP codes in this report, the median home was built before 2010.1
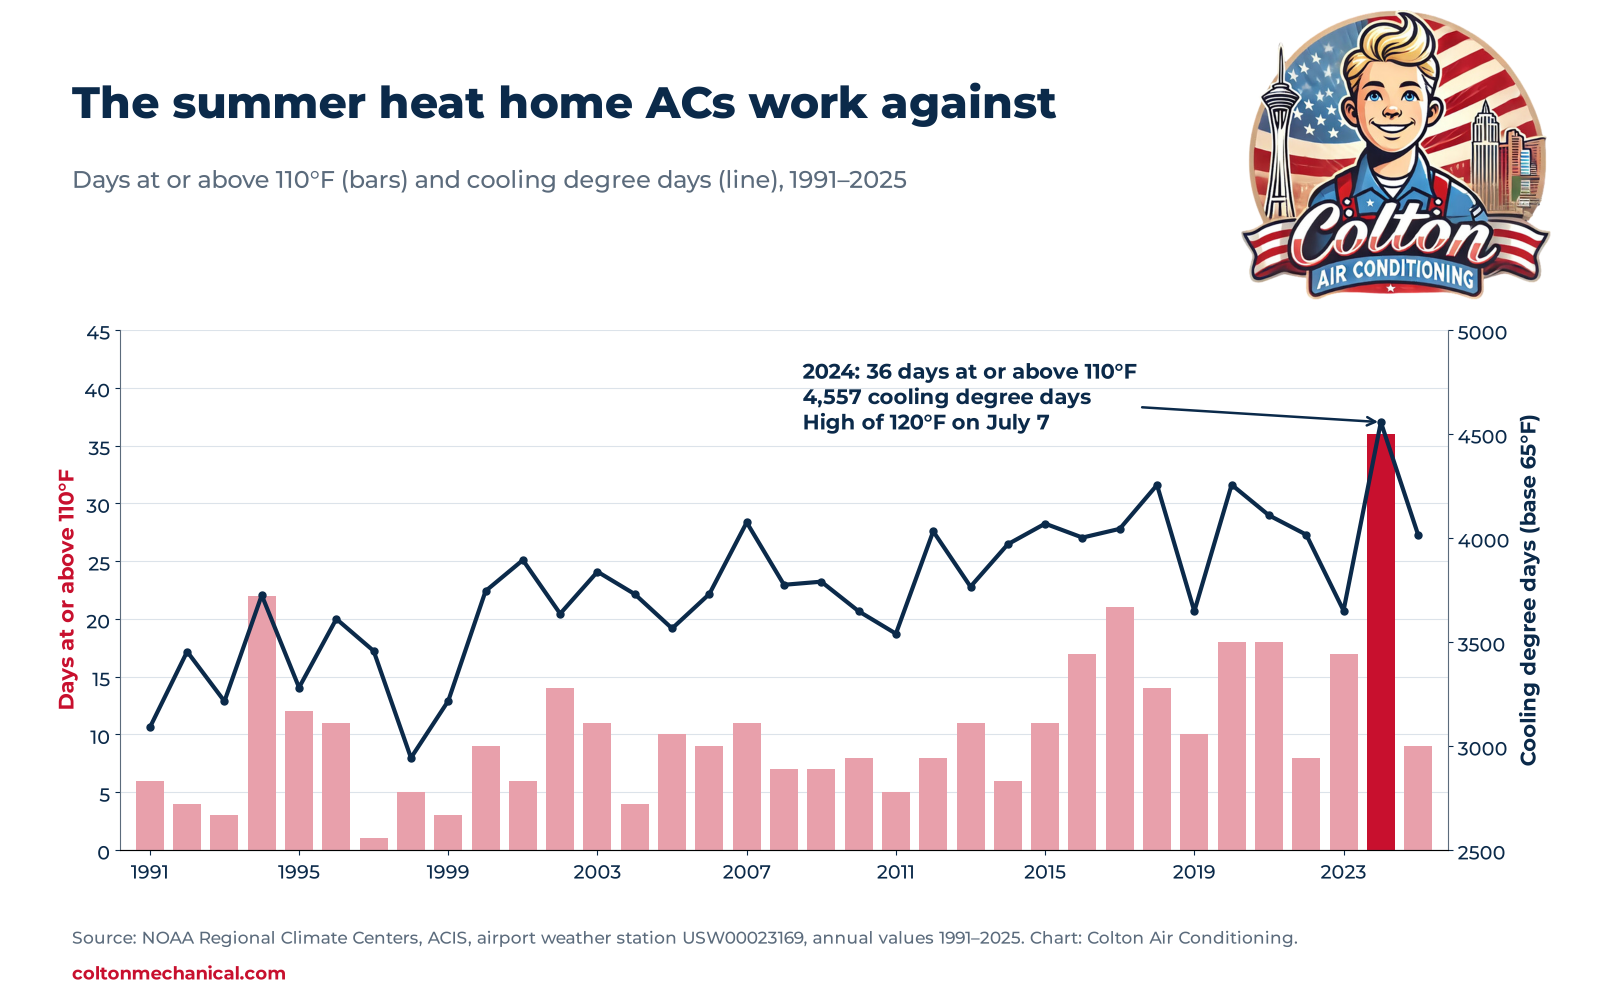
- The heat load is extreme, and 2024 topped every year since 1991. In 2024 the Las Vegas airport weather station logged 36 days at or above 110°F, 112 days at or above 100°F and 4,557 cooling degree days, and hit 120°F on July 7, 2024, the highest annual maximum in the station's 1949–2025 record.5
- Federal lifespan figures are longer than many owners expect, but they are models. The U.S. Department of Energy modeled an average lifetime of 24.9 years for central air conditioners in the hot-dry region that includes Nevada (21.2 years nationally) and 15.4 years for heat pumps.6 DOE's consumer guide separately suggests considering replacement once an AC or heat pump is more than 10 years old.7
- Rules set the timeline for older systems. New R-22 refrigerant may only be used in equipment manufactured before January 1, 2010, and U.S. production and import of R-22 ended January 1, 2020.810 Since January 1, 2023, new split air conditioners under 45,000 Btu/h installed in the Southwest region, which includes Nevada, must meet 14.3 SEER2.11
- Replacement and repair permits in the City of Las Vegas have risen. Residential permits carrying the City's HVAC change-out/repair fee code rose from 808 in 2011, the first full year the code appears, to 4,116 in 2025 (see caveats below).14
1. How old are Las Vegas-area homes?
Housing in Southern Nevada is much newer than the national housing stock. According to the U.S. Census Bureau's American Community Survey (ACS) 2020–2024 five-year estimates:12
| Area | Median year built | Built before 2000 | Built before 2010 | Built 2010 or later |
|---|---|---|---|---|
| Clark County | 1998 | 55.3% | 83.8% | 16.2% |
| City of Las Vegas | 1994 | 66.6% | 88.1% | 11.9% |
| Nevada | 1996 | 58.5% | 84.7% | 15.3% |
| United States | 1980 | 74.9% | 88.6% | 11.4% |
Two things stand out. First, a typical valley home is nearly two decades younger than a typical U.S. home. Second, even so, the large majority of valley homes were built before 2010, and that date matters for refrigerant (Section 4).
Across the 56 valley ZIP codes in this report, the median year built ranges from 1971 (89107) to 2014 (89086). In 33 of the 56 ZIP codes the median home was built in 2001 or earlier.1
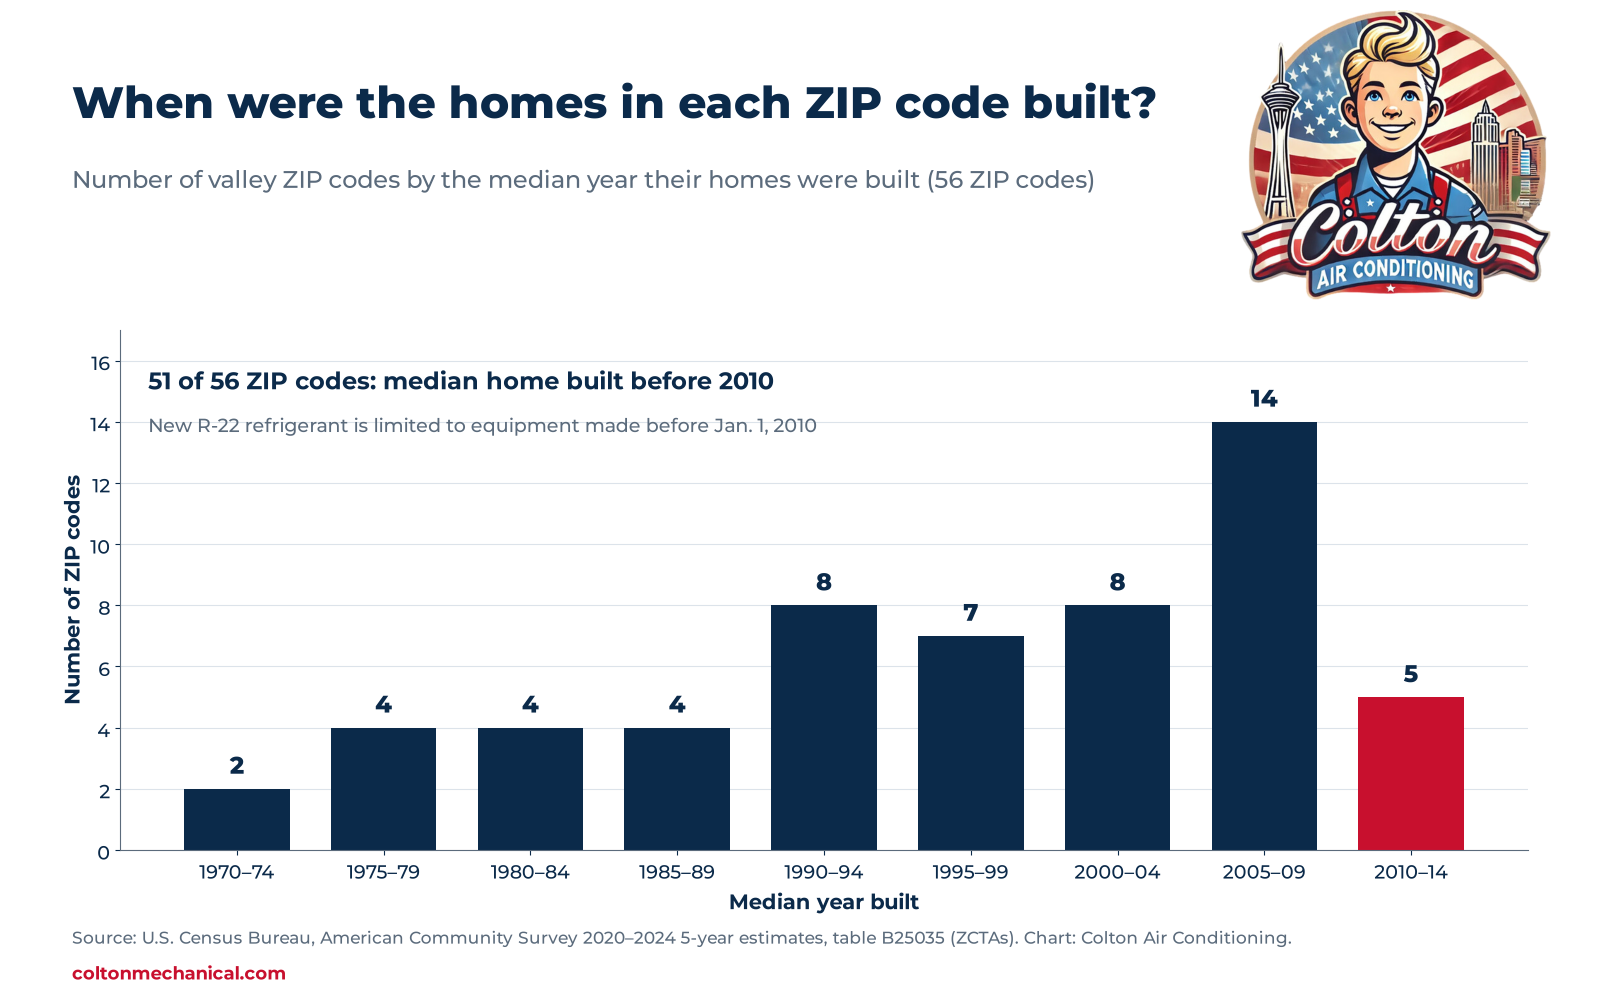
Home age is not AC age. Many homes have already had their air conditioning replaced, some more than once. The Census does not track HVAC equipment. Housing age tells you the earliest an original system could have been installed, not what is on the pad today.
2. ZIP-by-ZIP table
The table below covers 56 ZIP Code Tabulation Areas (ZCTAs) in the Las Vegas valley. ZCTAs are the Census Bureau's approximations of USPS ZIP codes. "MOE" is the 90% margin of error on the median year built. Shares of homes by year built use all housing units; owner-occupied and heating-fuel shares use occupied units.1234
Download: las-vegas-zip-housing-age-2024.csv
| ZIP | Median year built (MOE ±) | Housing units | Built before 2000 | Built 2000–2009 | Built 2010 or later | Owner-occupied | Heat: utility gas | Heat: electricity |
|---|---|---|---|---|---|---|---|---|
| 89002 (Henderson) | 2000 (±1) | 14,076 | 50.4% | 33.4% | 16.2% | 81.4% | 78.0% | 18.2% |
| 89011 (Henderson) | 2009 (±2) | 16,773 | 25.2% | 28.2% | 46.6% | 70.0% | 73.9% | 22.6% |
| 89012 (Henderson) | 2002 (±1) | 16,951 | 43.3% | 35.8% | 20.9% | 61.7% | 78.0% | 19.3% |
| 89014 (Henderson) | 1993 (±1) | 18,129 | 75.7% | 15.1% | 9.2% | 52.8% | 54.0% | 43.5% |
| 89015 (Henderson) | 1993 (±2) | 17,311 | 72.0% | 17.5% | 10.5% | 62.4% | 64.6% | 32.5% |
| 89030 | 1975 (±2) | 16,442 | 84.8% | 9.8% | 5.4% | 35.3% | 35.6% | 59.4% |
| 89031 | 2002 (±2) | 25,816 | 38.8% | 46.6% | 14.6% | 73.1% | 79.9% | 16.5% |
| 89032 | 2000 (±2) | 17,028 | 51.5% | 36.7% | 11.8% | 62.2% | 73.7% | 21.9% |
| 89044 (Henderson) | 2010 (±1) | 13,740 | 2.6% | 48.2% | 49.2% | 81.6% | 76.8% | 18.7% |
| 89052 (Henderson) | 2005 (±1) | 27,010 | 24.0% | 54.9% | 21.2% | 61.5% | 69.8% | 27.5% |
| 89074 (Henderson) | 1996 (±1) | 22,525 | 73.3% | 14.8% | 11.9% | 59.5% | 69.9% | 27.5% |
| 89081 | 2006 (±1) | 14,230 | 11.2% | 62.8% | 25.9% | 67.0% | 76.3% | 20.5% |
| 89084 | 2008 (±1) | 14,401 | 5.1% | 54.6% | 40.3% | 76.0% | 71.3% | 24.9% |
| 89085 | 2006 (±1) | 1,608 | 8.0% | 69.3% | 22.7% | 84.6% | 78.3% | 19.6% |
| 89086 | 2014 (±3) | 4,184 | 10.0% | 32.6% | 57.5% | 54.9% | 57.2% | 39.6% |
| 89101 | 1974 (±2) | 18,050 | 81.1% | 13.7% | 5.2% | 18.7% | 17.3% | 79.5% |
| 89102 | 1979 (±2) | 16,796 | 88.0% | 8.7% | 3.3% | 29.8% | 31.5% | 66.0% |
| 89103 | 1986 (±1) | 25,427 | 84.1% | 10.9% | 4.9% | 32.3% | 44.2% | 52.2% |
| 89104 | 1976 (±1) | 16,506 | 90.0% | 5.6% | 4.4% | 42.2% | 38.4% | 57.5% |
| 89106 | 1987 (±2) | 11,085 | 79.9% | 14.2% | 5.9% | 31.2% | 39.7% | 55.1% |
| 89107 | 1971 (±1) | 13,902 | 95.5% | 2.0% | 2.5% | 56.5% | 34.8% | 61.8% |
| 89108 | 1986 (±1) | 28,339 | 84.4% | 11.7% | 4.0% | 49.1% | 52.3% | 43.1% |
| 89109 | 2003 (±2) | 11,300 | 33.7% | 64.7% | 1.6% | 34.7% | 21.0% | 77.9% |
| 89110 | 1987 (±2) | 23,752 | 83.2% | 13.0% | 3.9% | 54.5% | 60.9% | 36.0% |
| 89113 | 2007 (±1) | 16,921 | 26.4% | 32.7% | 40.9% | 62.6% | 67.8% | 30.2% |
| 89115 | 1992 (±2) | 21,923 | 68.7% | 19.7% | 11.6% | 35.1% | 51.3% | 44.2% |
| 89117 | 1993 (±1) | 25,538 | 80.4% | 15.3% | 4.3% | 46.7% | 56.9% | 41.1% |
| 89118 | 1996 (±1) | 10,288 | 67.0% | 18.8% | 14.2% | 47.3% | 58.2% | 36.1% |
| 89119 | 1983 (±1) | 24,551 | 87.8% | 8.4% | 3.8% | 22.8% | 29.2% | 67.4% |
| 89120 | 1984 (±2) | 9,821 | 86.4% | 9.2% | 4.4% | 59.5% | 58.7% | 38.9% |
| 89121 | 1980 (±2) | 29,616 | 89.3% | 8.1% | 2.6% | 51.3% | 41.8% | 53.1% |
| 89122 | 2000 (±1) | 21,986 | 49.5% | 40.6% | 10.0% | 58.0% | 65.0% | 30.4% |
| 89123 | 1998 (±1) | 24,820 | 58.7% | 33.8% | 7.4% | 59.4% | 70.7% | 24.6% |
| 89128 | 1994 (±1) | 17,055 | 87.4% | 8.5% | 4.1% | 50.8% | 48.5% | 49.4% |
| 89129 | 1999 (±1) | 22,096 | 56.1% | 31.7% | 12.2% | 72.0% | 71.3% | 25.0% |
| 89130 | 1997 (±1) | 13,993 | 65.1% | 24.1% | 10.8% | 72.0% | 72.4% | 22.3% |
| 89131 | 2004 (±1) | 18,559 | 22.9% | 61.4% | 15.7% | 81.6% | 76.7% | 19.5% |
| 89134 | 1994 (±1) | 12,983 | 92.5% | 5.2% | 2.2% | 82.5% | 77.6% | 20.6% |
| 89135 | 2006 (±1) | 15,201 | 14.0% | 58.4% | 27.6% | 71.1% | 72.6% | 25.1% |
| 89138 | 2011 (±2) | 10,524 | 4.4% | 41.3% | 54.2% | 82.9% | 76.6% | 21.1% |
| 89139 | 2007 (±1) | 15,727 | 13.9% | 52.0% | 34.1% | 63.5% | 67.6% | 27.5% |
| 89141 | 2009 (±2) | 15,582 | 5.6% | 52.0% | 42.4% | 73.5% | 77.6% | 18.9% |
| 89142 | 1995 (±1) | 11,541 | 67.4% | 25.2% | 7.4% | 61.3% | 64.9% | 30.3% |
| 89143 | 2005 (±1) | 4,574 | 18.4% | 64.9% | 16.7% | 73.8% | 73.9% | 16.4% |
| 89144 | 2000 (±1) | 8,770 | 51.3% | 45.7% | 2.9% | 69.1% | 76.0% | 20.4% |
| 89145 | 1991 (±2) | 10,809 | 80.0% | 13.4% | 6.6% | 63.5% | 64.0% | 33.4% |
| 89146 | 1982 (±2) | 8,628 | 92.4% | 5.8% | 1.8% | 41.4% | 41.5% | 55.6% |
| 89147 | 1997 (±2) | 22,929 | 63.9% | 22.7% | 13.5% | 50.6% | 70.3% | 25.8% |
| 89148 | 2008 (±1) | 25,479 | 10.2% | 51.0% | 38.8% | 58.8% | 72.3% | 23.4% |
| 89149 | 2005 (±2) | 17,550 | 30.6% | 43.0% | 26.4% | 70.8% | 65.0% | 32.3% |
| 89156 | 1993 (±2) | 10,296 | 76.4% | 18.7% | 4.9% | 62.0% | 66.6% | 26.9% |
| 89166 | 2013 (±2) | 11,239 | 5.8% | 24.1% | 70.1% | 72.1% | 68.7% | 27.6% |
| 89169 | 1978 (±2) | 14,061 | 91.4% | 6.5% | 2.1% | 19.3% | 28.3% | 69.2% |
| 89178 | 2009 (±2) | 16,309 | 5.7% | 51.7% | 42.5% | 72.6% | 77.7% | 19.8% |
| 89179 | 2013 (±2) | 4,038 | 4.7% | 28.3% | 67.1% | 78.3% | 77.9% | 18.3% |
| 89183 | 2005 (±1) | 16,419 | 22.2% | 57.6% | 20.2% | 55.1% | 65.8% | 31.3% |
| Clark County, NV | 1998 (±1) | 948,995 | 55.3% | 28.6% | 16.2% | 57.8% | 60.2% | 36.2% |
| City of Las Vegas, NV | 1994 (±1) | 267,654 | 66.6% | 21.5% | 11.9% | 56.6% | 57.6% | 39.2% |
| Nevada | 1996 (±1) | 1,326,471 | 58.5% | 26.1% | 15.3% | 60.0% | 58.9% | 34.7% |
| United States | 1980 (±1) | 143,775,355 | 74.9% | 13.6% | 11.4% | 65.2% | 46.5% | 41.3% |
Source: U.S. Census Bureau, ACS 2020–2024 5-year estimates, tables B25035, B25034, B25003 and B25040. All estimates are subject to sampling error.
"Henderson" is shown for the 8 ZIP codes where at least 85% of the ZCTA's housing units in the 2020 Census are inside the City of Henderson (U.S. Census Bureau, 2020 Census blocks and TIGER boundaries). Other ZIP codes are shown without a place name.
The heating-fuel columns help explain what else is in the home: across Clark County, 60.2% of occupied homes heat mainly with utility gas and 36.2% with electricity.4 Homes that heat with electricity typically use a heat pump or an electric furnace.
3. Why AC systems work hard here: the heat load
Cooling degree days (CDD) measure how far, and for how long, the daily average temperature sits above 65°F. More CDD means more hours of air-conditioner run time. Data below are from NOAA's Applied Climate Information System (ACIS) for the Las Vegas airport weather station (Harry Reid International Airport, station USW00023169).5
| Measure | 1991–2020 average* | 2024 | 2025 |
|---|---|---|---|
| Cooling degree days (base 65°F) | 3,700 | 4,557 | 4,015 |
| Days at or above 100°F | 78.2 | 112 | 77 |
| Days at or above 110°F | 9.5 | 36 | 9 |
| Nights with a low of 90°F or higher | — | 22 | 0 |
| Highest temperature of the year | — | 120°F (July 7) | 112°F |
*Averages are calculated by Colton from ACIS annual values for 1991–2020. They are not NOAA's official 1991–2020 Climate Normals.
2024 had the most cooling degree days, the most 100°F days and the most 110°F days of any year from 1991 to 2025, and its 120°F high on July 7 is the highest annual maximum at the station in ACIS records from 1949 through 2025.5
4. How long do central air conditioners last? What official sources say
We did not find a published Las Vegas field study of AC lifespans. The most-cited federal figures are:
| Source | What it says | What kind of figure it is |
|---|---|---|
| U.S. DOE, 2017 direct final rule (82 FR 1786), Table IV-166 | Average lifetime: central AC 21.2 years nationally, 24.9 years in the hot-dry region (Arizona, California, Nevada, New Mexico); heat pumps 15.3 years nationally, 15.4 years hot-dry | Modeled from national shipment data for the efficiency rulemaking, not measured in Las Vegas homes |
| U.S. DOE, Energy Saver guide (2022)7 | Consider replacing if "your heat pump or air conditioner is more than 10 years old" (or a furnace or boiler more than 15) | A prompt to evaluate, not a failure date |
In practice, the age of the equipment is one factor among several: repair history, refrigerant type, efficiency, comfort problems and how well the system has been maintained.
5. The rules that shape replacement timing
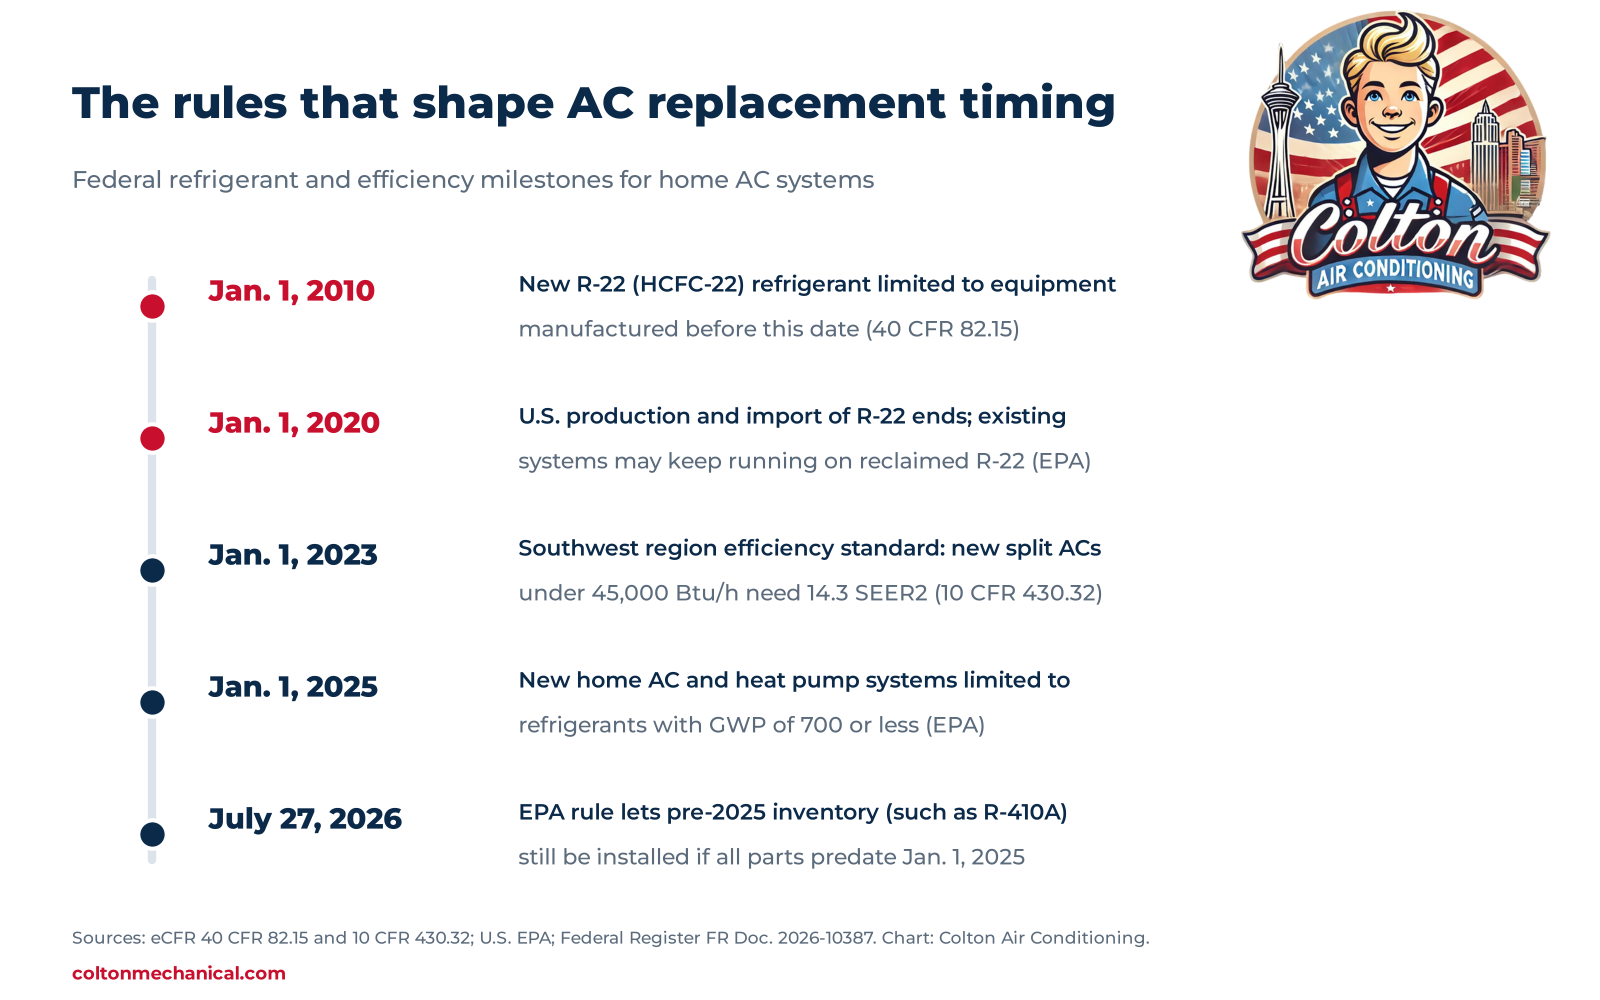
R-22 (HCFC-22). Federal rules limit the use of newly produced HCFC-22 as a refrigerant to equipment manufactured before January 1, 2010.10 U.S. production and import of HCFC-22 ended January 1, 2020; reclaimed and previously produced R-22 can still be used to service existing systems.89 EPA does not require homeowners to replace a working R-22 system, and notes there are no "drop-in" replacements for R-22.8
What this likely means for valley homes: a home built before 2010 that still has its original air conditioner may well be running on R-22. That is an inference from build dates and the federal rules, not a measured share; the Census does not record refrigerant type, and many pre-2010 homes have already had their systems replaced.
Efficiency (SEER2). Since January 1, 2023, split-system central air conditioners installed in the Southwest region (Arizona, California, Nevada and New Mexico) must meet regional minimums:11
| Split-system AC, certified cooling capacity | Minimum SEER2 | Minimum EER2 |
|---|---|---|
| Under 45,000 Btu/h | 14.3 | 11.7 (if SEER2 is under 15.2) or 9.8 (if SEER2 is 15.2 or higher) |
| 45,000 Btu/h or more | 13.8 | 11.2 (if SEER2 is under 15.2) or 9.8 (if SEER2 is 15.2 or higher) |
The national minimum for split-system heat pumps is 14.3 SEER2 and 7.5 HSPF2.11
Refrigerant transition (2025 onward). Beginning January 1, 2025, new residential and light-commercial air conditioning and heat pump systems are limited to refrigerants with a global warming potential (GWP) of 700 or less, such as R-454B or R-32.1213 An EPA final rule effective July 27, 2026, removed the installation deadline for systems whose specified components were all manufactured in or imported into the U.S. before January 1, 2025, so that older inventory, such as R-410A equipment, can still be installed.13 Components made for existing higher-GWP systems, such as R-410A, carry a "For servicing existing equipment only" label.13
6. Replacement and repair activity: City of Las Vegas permits
The City of Las Vegas publishes building-permit records through its open data portal. Counting residential permits that carry the City's fee code for "heating ventilation air conditioning (HVAC) exact change outs/repairs":14
| Year | Residential permits with HVAC change-out/repair fee code |
|---|---|
| 2011 | 808 |
| 2012 | 690 |
| 2013 | 470 |
| 2014 | 947 |
| 2015 | 932 |
| 2016 | 1,198 |
| 2017 | 1,790 |
| 2018 | 2,348 |
| 2019 | 2,736 |
| 2020 | 2,921 |
| 2021 | 3,582 |
| 2022 | 3,973 |
| 2023 | 3,975 |
| 2024 | 4,267 |
| 2025 | 4,116 |
| 2026 (through Nov. 12) | 3,776 |
Read these numbers with care: - They cover the City of Las Vegas only, not unincorporated Clark County, North Las Vegas or other cities in the valley. - The fee code covers both change-outs and repairs, so this is not a count of new systems. - The fee code first appears in the dataset in 2010 (15 permits that year), so the table starts with 2011, the first full year. Part of the rise may reflect changes in how permits are coded or pulled, not only more work. - Not every HVAC job is permitted. - The 2026 figure is a partial year.
7. A checklist for buyers, owners and inspectors
- Find the data plate on the outdoor unit (and the indoor coil or furnace). It lists the model, serial number and refrigerant type.
- Note the refrigerant. An R-22 system can legally keep running, but servicing depends on reclaimed refrigerant.8
- Estimate the age. Many manufacturers encode the manufacture date in the serial number; a licensed technician or home inspector can read it.
- Ask for records: permits, installation paperwork and maintenance history.
- Check the efficiency rating (SEER2 or SEER) on the paperwork or the AHRI certificate if the system is recent.
- Gas heat safety: Smell gas or hear a hiss? Leave the house right away. Don't use light switches, thermostats, appliance controls or anything that could spark. Once you're outside, call 911 and Southwest Gas (877-860-6020). If a CO alarm sounds, get everyone outside and call 911.
Methodology
- Housing age, tenure and heating fuel: U.S. Census Bureau, American Community Survey 2020–2024 5-year estimates, tables B25035 (median year structure built), B25034 (year structure built), B25003 (tenure) and B25040 (house heating fuel), for 56 ZCTAs in the Las Vegas valley plus Clark County, the City of Las Vegas, Nevada and the United States.1234 Values were taken from the Census Bureau's ACS Table-Based Summary File and cross-checked against a second compilation of the same tables. Percentages are calculated by Colton from the published estimates; margins of error for derived percentages were not calculated. ZCTAs approximate, but do not exactly match, USPS ZIP codes.
- Climate: NOAA Regional Climate Centers, ACIS station data for Harry Reid International Airport (GHCN ID USW00023169), annual values for 1991–2025 (years with more than 10 missing days excluded; none were) and annual maximum temperatures for 1949–2025.5 Averages are calculated by Colton and are not official NOAA Climate Normals.
- Rules and lifespans: quoted directly from the Electronic Code of Federal Regulations, the Federal Register, U.S. EPA and U.S. DOE publications, accessed November 12, 2026.6–13
- Permits: City of Las Vegas Open Data, "Building Permits" dataset, counted with server-side aggregate queries (no names or addresses were downloaded), accessed November 12, 2026.14
- What this report does not do: it does not estimate how many homes have original equipment or R-22 systems, and it does not use any customer data.
FAQ
How can I tell how old my air conditioner is? Look at the data plate on the outdoor unit. The manufacture date is often encoded in the serial number, and the format varies by brand, so a licensed technician or home inspector can confirm it.
Do I have to replace an R-22 air conditioner? No. EPA does not require homeowners to replace working R-22 equipment. New R-22 is no longer produced or imported, so service relies on reclaimed or previously produced refrigerant.8
If my home was built before 2010, is my AC original? Not necessarily. Many valley homes have had their systems replaced. Build year only tells you the earliest an original system could date from.
What is SEER2? SEER2 is the seasonal efficiency rating used for central air conditioners and heat pumps since 2023. In Nevada, new split-system air conditioners under 45,000 Btu/h must be rated at least 14.3 SEER2.11
Why are some ZIP codes missing? The report covers 56 residential ZCTAs across the valley. Others can be added on request in a future update.
How often will this be updated? We plan to refresh the Census and NOAA data when new releases are available.
Suggested citation
Colton Air Conditioning. Las Vegas AC Age Report 2026: Home Age by ZIP Code, Summer Heat and Replacement Timing. November 2026. coltonmechanical.com/las-vegas-ac-age-report
Journalists, real-estate professionals and inspectors may reuse the charts and table with a credit and link to this page.
Questions about this report?
Call (702) 738-6976 · https://coltonmechanical.com Colton Air Conditioning · NV Lic. 0092120
Sources
-
U.S. Census Bureau, ACS 2020–2024 5-year estimates, Table B25035 (Median Year Structure Built). https://data.census.gov/table/ACSDT5Y2024.B25035 · Summary file: https://www2.census.gov/programs-surveys/acs/summary_file/2024/table-based-SF/data/5YRData/acsdt5y2024-b25035.dat ↩↩↩↩↩↩
-
U.S. Census Bureau, ACS 2020–2024 5-year estimates, Table B25034 (Year Structure Built). https://data.census.gov/table/ACSDT5Y2024.B25034 · Summary file: https://www2.census.gov/programs-surveys/acs/summary_file/2024/table-based-SF/data/5YRData/acsdt5y2024-b25034.dat ↩↩↩↩
-
U.S. Census Bureau, ACS 2020–2024 5-year estimates, Table B25003 (Tenure). https://data.census.gov/table/ACSDT5Y2024.B25003 · Summary file: https://www2.census.gov/programs-surveys/acs/summary_file/2024/table-based-SF/data/5YRData/acsdt5y2024-b25003.dat ↩↩
-
U.S. Census Bureau, ACS 2020–2024 5-year estimates, Table B25040 (House Heating Fuel). https://data.census.gov/table/ACSDT5Y2024.B25040 · Summary file: https://www2.census.gov/programs-surveys/acs/summary_file/2024/table-based-SF/data/5YRData/acsdt5y2024-b25040.dat ↩↩↩
-
NOAA Regional Climate Centers, Applied Climate Information System (ACIS), station data for Harry Reid International Airport (USW00023169). https://data.rcc-acis.org/StnData · https://www.rcc-acis.org/ ↩↩↩↩
-
U.S. Department of Energy, "Energy Conservation Program: Energy Conservation Standards for Residential Central Air Conditioners and Heat Pumps," direct final rule, 82 FR 1786 (Jan. 6, 2017), Table IV-16. https://www.govinfo.gov/content/pkg/FR-2017-01-06/html/2016-29992.htm ↩↩↩
-
U.S. Department of Energy, Energy Saver: Tips on Saving Money and Energy in Your Home (2022). https://www.energy.gov/sites/default/files/2022-08/energy-saver-guide-2022.pdf ↩↩
-
U.S. EPA, "Homeowners and Consumers: Frequently Asked Questions" (HCFC phaseout). https://www.epa.gov/ods-phaseout/homeowners-and-consumers-frequently-asked-questions ↩↩↩↩↩
-
U.S. EPA, "Residential Air Conditioning and the Phaseout of HCFC-22: What You Need to Know" (EPA-430-FR-20001, 2020). https://www.epa.gov/sites/default/files/2020-03/documents/residential_air_conditioning_and_the_phaseout_of_hcfc-22_what_you_need_to_know_final_508.pdf ↩
-
40 CFR 82.15(g). https://www.ecfr.gov/current/title-40/chapter-I/subchapter-C/part-82/subpart-A/section-82.15 ↩↩
-
10 CFR 430.32(c)(5)–(6). https://www.ecfr.gov/current/title-10/chapter-II/subchapter-D/part-430/subpart-C/section-430.32 ↩↩↩↩
-
U.S. EPA, "Technology Transitions HFC Restrictions by Sector." https://www.epa.gov/hfcs/technology-transitions-hfc-restrictions-sector ↩
-
U.S. EPA final rule, Federal Register Doc. 2026-10387 (published May 26, 2026; effective July 27, 2026). https://www.federalregister.gov/documents/full_text/html/2026/05/26/2026-10387.html ↩↩↩↩
-
City of Las Vegas Open Data, "Building Permits." https://opendataportal-lasvegas.opendata.arcgis.com/ · https://services1.arcgis.com/F1v0ufATbBQScMtY/arcgis/rest/services/OpenData_Building_Permits_/FeatureServer/0 ↩↩↩